Market Outlook
July 21, 2017
Market Cues
Domestic Indices
Chg (%)
(Pts)
(Close)
Indian markets are likely to remain range bound tracking global indices.
BSE Sensex
(0.2)
(51)
31,904
US markets showed a lack of direction over the course of the trading session on
Nifty
(0.3)
(26)
9,873
Thursday, with the major averages bouncing back and forth across the unchanged
Mid Cap
(0.5)
(80)
15,179
line. Despite the lackluster performance, the tech-heavy Nasdaq reached a new
Small Cap
0.2
125
16,000
record closing high. The choppy trading on Wall Street partly reflected uncertainty
Bankex
0.2
52
27,427
about the outlook for the markets after the major averages reached new record
closing highs on Wednesday.
Global Indices
Chg (%)
(Pts)
(Close)
The European markets spent much of Thursdays session in positive territory, but
remained stuck in a sideways pattern. However, the majority of the markets dropped
Dow Jones
(0.1)
(29)
21,612
in late trade and finished the session in the red.
Nasdaq
0.1
55
6,390
Indian markets ended a range-bound session slightly lower on Thursday ahead of
FTSE
0.8
57
7,488
earnings results from market heavyweight Reliance Industries, due out later in the
Nikkei
(00.6
124
20,145
day.
Hang Seng
0.3
268
26,740
Shanghai Com
0.4
14
3,245
News Analysis
Result Review - Bajaj Auto (CMP: `2,817 / TP: `3,067/Upside: 9%)
Advances / Declines
BSE
NSE
Advances
1,277
1,782
Result Review - Alembic Pharmaceuticals (CMP: `588/ TP: `648/Upside: 10.2%)
Declines
1,460
903
Result Review - Wipro (CMP: `269 / TP: `280/Upside: 4%)
Unchanged
150
74
Detailed analysis is on Pg2-3
Investor’s Ready Reckoner
Volumes (` Cr)
BSE
3,894
Key Domestic & Global Indicators
NSE
25,835
Stock Watch: Latest investment recommendations on 150+ stocks
Refer Pg7 onwards
#Net Inflows (` Cr)
Net
Mtd
Ytd
Top Picks
FII
1,01)
7
1,347)
57,255
CMP
Target
Upside
Company
Sector
Rating
(`)
(`)
(%)
MFs
417
4,892
44,038
Blue Star
Capital Goods
Buy
655
760
16.1
Dewan Housing FinanceFinancials
Accumulate
478
520
8.9
Top Gainers
Price (`)
Chg (%)
Mahindra Lifespace
Real Estate
Buy
440
522
18.7
Strtech m
207
20.0
Navkar Corporation
Others
Buy
206
265
28.7
KEI Industries
Capital Goods
Accumulate
240
258
7.7
Renuka
17
10.1
More Top Picks on Pg5
Sintex
38
7.8
Key Upcoming Events
Justdial
378
6.7
Previous
Consensus
Date
Region
Event Description
Enginersin
165
4.9
Reading
Expectations
Jul 24, 2017
Euro Zone ECB announces interest rates
-
-
Jul24, 2017
Germany PMI Manufacturing
59.60
Top Losers
Price (`)
Chg (%)
Jul 24, 2017
UK
GDP (YoY)
2.00
1.70
Wabag
612
(8.7)
Jul 25, 2017
US
Existing home sales
5.62
5.54
Kec
295
(5.4)
Jul 26, 2017
US
Consumer Confidence
118.90
116.00
Canbk
352
(5.1)
More Events on Pg7
Videoind
25
(5.0)
Mindtree
484
(4.5)
#as on 20t July, 2017
Market Outlook
July 21, 2017
News Analysis
Bajaj Auto (CMP: `2,817 / TP: `3,067/Upside: 9%)
Bajaj Auto reported mix set of numbers in 1QFY18 with revenue and EBITDA
below the consensus estimates by 1.5% and 13% respectively. Profit after tax
however beat the consensus estimates by 2%; this was mainly aided by yoy 71%
jump in the other income. Overall net sales and PAT declined by 5% (yoy) and 6%
(yoy) respectively to `5,442cr and Rs 524cr. EBITDA was at ` 938cr, declining 20%
(yoy) due to sharp increase in the raw material costs. EBITDA margin was at 17.2%
vs. 18.5% in 4QFY17 and 20.5% in 1QFY17. While yoy PAT decline at 5.5% was
less than decline in operating profit, this was due by the steep increase in other
income. During the quarter, company incurred `32cr expenses to compensate the
losses incurred by dealers on account of GST implementation. Adjusted for this,
PAT is at `956cr.
Blended realization was at `59,976 showing a yoy growth of 5.7% and qoq
decline of 1.7%. Raw material cost per vehicle grew by 10% yoy showing steep
increase in the raw material prices. Company has indicated that the due to the
lower sales volumes in the quarter, it had to absorb the overheads in the first
quarter which led to decline in the operating performance and expects a better
performance in second quarter. The stock is currently trading at 16.3% of FY19E
earnings. We have an accumulate rating on the stock with price target of `3,067.
Y/E
Sales OPM
PAT
EPS ROE P/E P/BV EV/EBITDA EV/Sales
March
(` cr)
(%)
(` cr)
(`)
(%)
(x)
(x)
(x)
(x)
FY2018E
23,383
20.7
4,261
146.1
22.1
19.3
4.3
16.7
3.4
FY2019E
27,057
21.8
4,999
172.7
23.3
16.3
3.8
13.6
3.0
Alembic Pharmaceuticals (CMP: `588/ TP: `648/Upside: 10.2%)
Alembic Pharmaceuticals, announced 1QFY2018 poor results. Sales came in at
`648cr V/s `737cr in 1QFY2017, a yoy dip of 12.1%. International formulation
came in at `282cr V/s `309cr, a yoy dip of 8.7%. Indian formulation sales at
`236cr V/s `299cr, a yoy dip of 21.0%. EBDITA came in at 16% V/s 21% in
1QFY2017, one of reason being rise in R&D expenses which were at 14% V/s 11%
of sales in 1QFY2017. Consequently, the PAT came in at `65cr V/s `102cr, a yoy
dip of 36%. We maintain our accumulate rating on the stock with a target price of
`648.
Y/E
Sales OPM
PAT
EPS ROE P/E P/BV EV/EBITDA EV/Sales
March
(` cr)
(%)
(` cr)
(`)
(%)
(x)
(x)
(x)
(x)
FY2018E
3,966
20.5
481
25.5
22.8
21.9
4.5
13.1
2.7
FY2019E
4,656
20.4
555
29.5
21.5
18.9
3.7
11.1
2.3
Market Outlook
July 21, 2017
Wipro (CMP: `269 / TP: `280/Upside: 4%)
Wipro, announced 1QFY2018 good set of numbers. The IT services sales came in
at US$1,971.7mn V/s US$1,950mn expected, a qoq growth of 0.9% qoq, while
constant currency (CC) qoq growth of 0.3%.In Rupee terms, `13,630cr V/s
`12,610cr expected, a qoq dip of 2.6%. For 2QFY2018, the company expects
revenues from its IT Services business to be in the range of $1,962mn to
$2,001mn. In terms of verticals it was BFSI, which drove the growth during the
quarter, posting a CC qoq growth 3.2%, while Energy, Natural Resources and
utilizes posted a CC qoq growth of 2.2%. In geography terms, APAC & other
emerging markets posted a CC qoq 2.6%, while India and Middle east market
posted a qoq growth of qoq CC 5.1%.
On operating front, the EBIT margins came in at 16.2% V/s 14.3% in 4QFY2017,
mainly driven by the better than expected growth and internal efficiencies. This was
against the expectations of 13.0%. The utilizations levels of the company were
72.0% in 1QFY2018 V/s 71.5% in 4QFY2017. Attrition during the quarter was
around 16.1% Vs 16.3% in 4QFY2017. Client addition during the quarter was
poor, with company adding only 2 clients in the US$50mn+ category and major
of rest added in the US$1mn+ category. The net profit during the quarter was `
2,082cr V/s `1,659cr expected a qoq dip of 8.1%.
On the positive side, the Board of Directors approved a buyback proposal, subject
to the approval of shareholders through postal ballot, for purchase by the
company of up to 343.75mn equity shares of ₹2 each (representing 7.06% of total
equity capital) from the shareholders of the company on a proportionate basis by
way of a tender offer. The buyback price will be ₹320 ($4.95)1 per equity share
payable in cash for an aggregate amount not exceeding ₹110,000 million ($1.7
billion) in accordance with the provisions of Companies Act, 2013 and the SEBI
(Buy Back of Securities) Regulations, 1998 (Buyback Regulations).
Thus to sum it up the quarter, was better than expected on all fronts, mainly driven
by better than expected volume growth during the quarter, however the company
expects the growth to come by only in 4QFY2018, while 2QFY2018 is again
expected to be weak with a almost a flattish quarter. However unless the
company’s client addition becomes strong, the company is unlikely to witness
sustained growth, which most of the large cap IT companies deliver. The buy back
is a good amount and is been done at a good price and will see a stock price rise
in the immediate future. However, at the given price the stock is more than fairly
priced for near term and hence investors can tender their shares. We maintain our
neutral rating on the stock.
Y/E
Sales OPM
PAT
EPS ROE P/E P/BV EV/EBITDA EV/Sales
March
(` cr)
(%)
(` cr)
(`)
(%)
(x)
(x)
(x)
(x)
FY2018E
58,536
20.3
8,863
18.2
14.6
14.8
2.3
7.2
1.5
FY2019E
61,858
20.3
9,276
19.1
13.4
14.1
2.0
6.1
1.2
Market Outlook
July 21, 2017
Economic and Political News
Odisha sets target of `1 lakh crore export turnover by 2025
GST impact: Effective coal prices reduce by 2-3% for power sector consumers
Co-working spaces to grow 50% in 2017, says JLL India chief
Growth numbers to improve from June quarter: Morgan Stanley
Corporate News
Natco Pharma receives FDA inspection report on Kothur formulations facility
RIL Q1 profit up 8.6% at `8,196Cr; GRM at $11.9 per bbl
Wipro beats the Street in June quarter profit, announces `11k-cr buyback
Hindustan Zinc quarterly profit up 81% as metal prices increase
Market Outlook
July 21, 2017
Top Picks HHHHH
Market Cap
CMP
Target
Upside
Company
Rationale
(` Cr)
(`)
(`)
(%)
Strong growth in domestic business due to its leadership
in acute therapeutic segment. Alkem expects to launch
Alkem Laboratories
21,612
1,808
2,161
19.6
more products in USA, which bodes for its international
business.
We expect the company would report strong profitability
Asian Granito
1,299
432
480
11.2
owing to better product mix, higher B2C sales and
amalgamation synergy.
Favourable outlook for the AC industry to augur well for
Cooling products business which is out pacing the
Blue Star
6,269
655
760
16.1
market growth. EMPPAC division's profitability to improve
once operating environment turns around.
With a focus on the low and medium income (LMI)
consumer segment, the company has increased its
Dewan Housing Finance
14,975
478
520
8.9
presence in tier-II & III cities where the growth
opportunity is immense.
Loan growth is likely to pick up after a sluggish FY17.
Karur Vysya Bank
8,503
141
160
13.7
Lower credit cost will help in strong bottomline growth.
Increasing share of CASA will help in NIM improvement.
High order book execution in EPC segment, rising B2C
KEI Industries
1,864
240
258
7.7
sales and higher exports to boost the revenues and
profitability
Speedier execution and speedier sales, strong revenue
Mahindra Lifespace
2,256
440
522
18.7
visibilty in short-to-long run, attractive valuations
Massive capacity expansion along with rail advantage at
Navkar Corporation
2,936
206
265
28.7
ICD as well CFS augurs well for the company
Strong brands and distribution network would boost
Siyaram Silk Mills
2,253
2,403
2,500
3.0
growth going ahead. Stock currently trades at an
inexpensive valuation.
Market leadership in Hindi news genre and no.
2
viewership ranking in English news genre, exit from the
TV Today Network
1,491
250
344
37.6
radio business, and anticipated growth in ad spends by
corporates to benefit the stock.
After GST, the company is expected to see higher
volumes along with improving product mix. The Gujarat
Maruti
2,26,279
7,491
8,495
13.4
plant will also enable higher operating leverage which
will be margin accretive.
Source: Company, Angel Research,
Market Outlook
July 21, 2017
Quarterly Bloomberg Brokers Consensus Estimate
Ashok Leyland Ltd - July 21, 2017
Particulars ( ` cr)
1QFY18E
1QFY17
y-o-y (%)
4QFY17
q-o-q (%)
Net sales
4,002
4,176
(4.2)
6,618
(39.5)
EBITDA
345
476
(27.6)
730
(52.8)
EBITDA margin (%)
8.6
11.4
11.0
Net profit
153
291
(47.3)
722
(78.8)
Market Outlook
July 21, 2017
Key Upcoming Events
Global economic events release calendar
Bloomberg Data
Date
Time
Country
Event Description
Unit
Period
Last Reported
Estimated
Jul 24, 2017
5:15 PMEuro Zone
ECB announces interest rates
%
Jul 20
-
-
1:00 PMGermany
PMI Manufacturing
Value
Jul P
59.60
2:00 PMUK
GDP (YoY)
% Change
2Q A
2.00
1.70
Jul 25, 2017
7:30 PMUS
Existing home sales
Million
Jun
5.62
5.54
Jul 26, 2017
7:30 PMUS
Consumer Confidence
S.A./ 1985=100
Jul
118.90
116.00
7:30 PMUS
New home sales
Thousands
Jun
610.00
615.50
11:30 PMUS
FOMC rate decision
%
Jul 26
1.25
1.25
Jul 28, 2017
6:00 PMUS
GDP Qoq (Annualised)
% Change
2Q A
1.40
2.60
Jul 31, 2017
6:30 AMChina
PMI Manufacturing
Value
Jul
51.70
Aug 01, 2017
1:25 PMGermany
Unemployment change (000's)
Thousands
Jul
7.00
2:00 PMUK
PMI Manufacturing
Value
Jul
54.30
2:30 PMEuro Zone
Euro-Zone GDP s.a. (QoQ)
% Change
2Q A
0.60
Aug 02, 2017
2:30 PMIndia
RBI Reverse Repo rate
%
Aug 2
6.00
2:30 PMIndia
RBI Repo rate
%
Aug 2
6.25
4:30 PMUK
BOE Announces rates
% Ratio
Aug 3
0.25
0.25
Aug 03, 2017
2:30 PMIndia
RBI Cash Reserve ratio
%
Aug 2
4.00
Aug 04, 2017
6:00 PMUS
Change in Nonfarm payrolls
Thousands
Jul
222.00
175.00
6:00 PMUS
Unnemployment rate
%
Jul
4.40
4.30
Aug 08, 2017
China
Exports YoY%
% Change
Jul
11.30
Aug 09, 2017
7:00 AMChina
Consumer Price Index (YoY)
% Change
Jul
1.50
Aug 10, 2017
India
Imports YoY%
% Change
Jul
19.00
Source: Bloomberg, Angel Research
Market Outlook
July 21, 2017
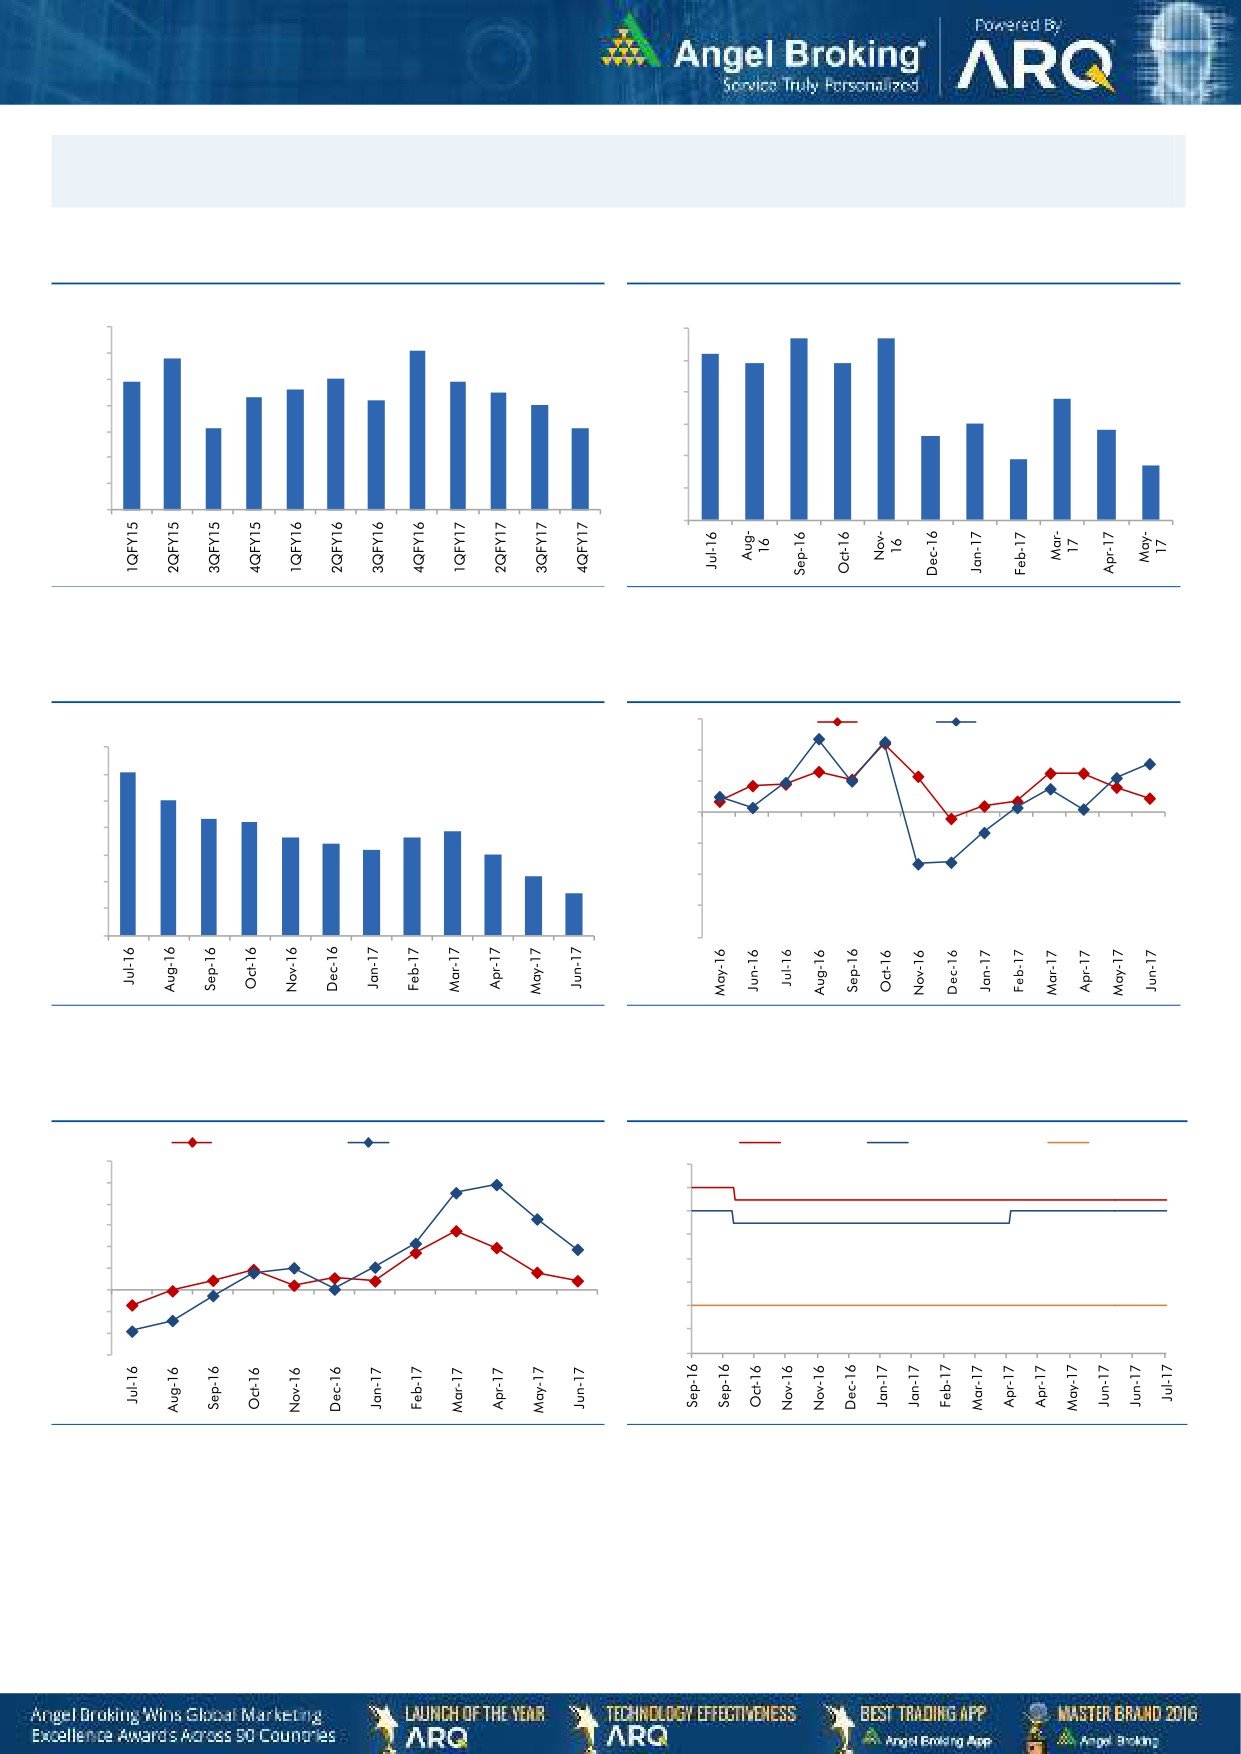
Macro watch
Exhibit 1: Quarterly GDP trends
Exhibit 2: IIP trends
(%)
(%)
5.7
5.7
10.0
6.0
9.1
5.2
8.8
4.9
4.9
9.0
7.9
8.0
7.9
5.0
7.6
7.5
8.0
7.3
7.2
3.8
7.0
4.0
7.0
3.0
6.1
6.1
2.8
2.6
3.0
6.0
1.9
1.7
5.0
2.0
4.0
1.0
3.0
-
Source: CSO, Angel Research
Source: MOSPI, Angel Research
Exhibit 3: Monthly CPI inflation trends
Exhibit 4: Manufacturing and services PMI
56.0
Mfg. PMI
Services PMI
(%)
7.0
54.0
6.1
6.0
5.1
52.0
5.0
4.3
4.2
3.9
50.0
3.6
3.7
4.0
3.4
3.2
3.0
48.0
3.0
2.2
1.5
46.0
2.0
1.0
44.0
-
42.0
Source: MOSPI, Angel Research
Source: Market, Angel Research; Note: Level above 50 indicates expansion
Exhibit 5: Exports and imports growth trends
Exhibit 6: Key policy rates
(%)
Exports yoy growth
Imports yoy growth
(%)
Repo rate
Reverse Repo rate
CRR
60.0
7.00
50.0
6.50
40.0
6.00
30.0
5.50
20.0
5.00
10.0
4.50
0.0
4.00
(10.0)
(20.0)
3.50
(30.0)
3.00
Source: Bloomberg, Angel Research
Source: RBI, Angel Research
Market Outlook
July 21, 2017
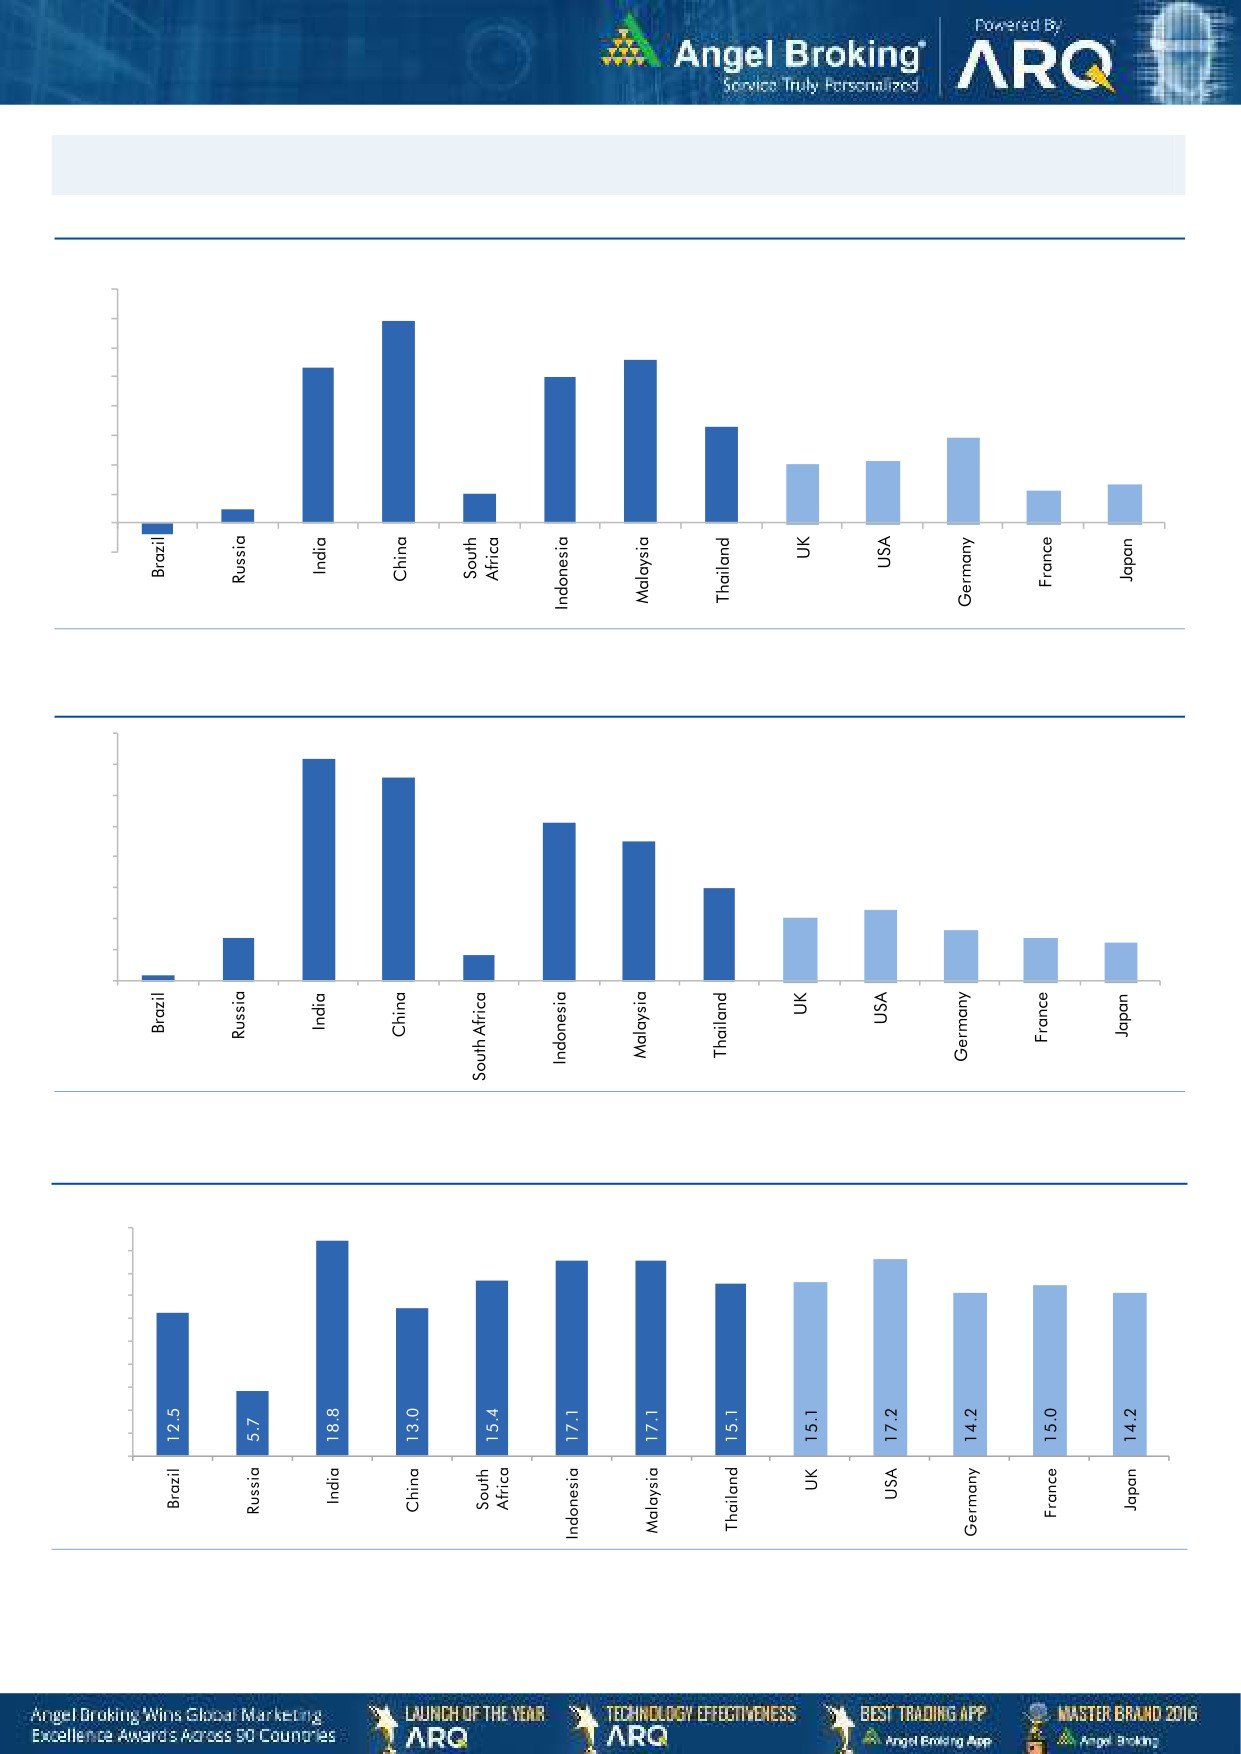
Global watch
Exhibit 1: Latest quarterly GDP Growth (%, yoy) across select developing and developed countries
(%)
8.0
6.9
7.0
5.6
6.0
5.3
5.0
1.0
5.0
4.0
3.3
2.9
3.0
2.0
2.1
2.0
0.5
1.1
1.3
1.0
-
(1.0)
(0.4)
Source: Bloomberg, Angel Research
Exhibit 2: 2016 GDP Growth projection by IMF (%, yoy) across select developing and developed countries
(%)
7.2
6.6
7.0
6.0
5.1
5.0
4.5
4.0
3.0
3.0
2.3
2.0
1.4
1.6
2.0
1.4
1.2
0.2
0.8
1.0
-
Source: IMF, Angel Research
Exhibit 3: One year forward P-E ratio across select developing and developed countries
(x)
20.0
18.0
16.0
14.0
12.0
10.0
8.0
6.0
4.0
2.0
-
Source: IMF, Angel Research
Market Outlook
July 21, 2017
Exhibit 4: Relative performance of indices across globe
Returns (%)
Country
Name of index
Closing price
1M
3M
1YR
Brazil
Bovespa
64,938
6.9
1.2
15.0
Russia
Micex
1,947
4.8
0.2
1.0
India
Nifty
9,873
2.2
8.5
15.6
China
Shanghai Composite
3,245
2.6
2.1
8.1
South Africa
Top 40
47,910
6.5
4.4
3.2
Mexico
Mexbol
51,144
4.3
4.1
8.0
Indonesia
LQ45
976
1.4
2.9
12.9
Malaysia
KLCI
1,756
(2.0)
1.4
5.7
Thailand
SET 50
999
0.3
0.1
6.9
USA
Dow Jones
21,612
0.4
5.9
16.7
UK
FTSE
7,488
0.2
5.3
11.3
Japan
Nikkei
20,145
0.4
9.7
25.2
Germany
DAX
12,447
(2.9)
3.6
21.5
France
CAC
5,199
(1.8)
2.4
17.6
Source: Bloomberg, Angel Research, #Data as on 20th July
Stock Watch
July 21, 2017
Company Name
Reco
CMP
Target
Mkt Cap
Sales ( Čcr )
OPM(%)
EPS (Č)
PER(x)
P/BV(x)
RoE(%)
EV/Sales(x)
(Č)
Price ( Č)
( Č cr )
FY17E FY18E
FY17E
FY18E
FY17E
FY18E
FY17E
FY18E
FY17E
FY18E
FY17E
FY18E
FY17E
FY18E
Agri / Agri Chemical
Rallis
Reduce
242
209
4,705
1,937
2,164
13.3
14.3
9.0
11.0
26.9
22.0
4.7
4.1
18.4
19.8
2.5
2.2
United Phosphorus
Neutral
856
-
43,480
15,176
17,604
18.5
18.5
37.4
44.6
22.9
19.2
4.5
3.7
21.4
21.2
3.0
2.5
Auto & Auto Ancillary
Ashok Leyland
Accumulate
106
116
31,007
20,019
22,789
11.1
11.7
4.3
5.5
24.7
19.4
4.8
4.3
19.4
22.0
1.5
1.3
Bajaj Auto
Neutral
2,819
-
81,562
25,093
27,891
19.5
19.2
143.9
162.5
19.6
17.4
5.5
4.7
30.3
29.4
3.0
2.6
Bharat Forge
Neutral
1,135
-
26,412
7,726
8,713
20.5
21.2
35.3
42.7
32.1
26.6
5.9
5.4
18.9
20.1
3.5
3.0
Eicher Motors
Neutral
29,253
-
79,632
16,583
20,447
17.5
18.0
598.0
745.2
48.9
39.3
16.7
12.7
41.2
38.3
4.6
3.7
Gabriel India
Neutral
150
-
2,155
1,544
1,715
9.0
9.3
5.4
6.3
27.8
23.8
5.3
4.7
18.9
19.5
1.4
1.2
Hero Motocorp
Neutral
3,730
-
74,478
28,120
30,753
15.2
15.6
169.1
189.2
22.1
19.7
7.6
6.4
30.8
28.2
2.5
2.2
Jamna Auto Industries Neutral
267
-
2,130
1,486
1,620
9.8
9.9
15.0
17.2
17.8
15.5
3.9
3.3
21.8
21.3
1.5
1.4
L G Balakrishnan & Bros Neutral
788
-
1,237
1,302
1,432
11.6
11.9
43.7
53.0
18.0
14.9
2.5
2.3
13.8
14.2
1.0
0.9
Mahindra and Mahindra Neutral
1,393
-
86,493
46,534
53,077
11.6
11.7
67.3
78.1
20.7
17.8
3.4
2.9
15.4
15.8
1.8
1.6
Maruti
Accumulate
7,491
8,495
226,279
67,822
83,717
15.2
15.0
243.0
291.5
30.8
25.7
7.1
5.7
22.9
22.4
3.0
2.4
Minda Industries
Neutral
707
-
6,111
2,728
3,042
9.0
9.1
68.2
86.2
10.4
8.2
2.4
1.9
23.8
24.3
2.3
2.0
Motherson Sumi
Neutral
322
-
67,807
45,896
53,687
7.8
8.3
13.0
16.1
24.7
20.0
8.0
6.4
34.7
35.4
1.5
1.3
Rane Brake Lining
Neutral
1,343
-
1,063
511
562
11.3
11.5
28.1
30.9
47.8
43.5
7.3
6.6
15.3
15.0
2.2
2.0
Setco Automotive
Neutral
44
-
586
741
837
13.0
13.0
15.2
17.0
2.9
2.6
0.5
0.4
15.8
16.3
1.2
1.1
Tata Motors
Neutral
460
-
132,876
300,209
338,549
8.9
8.4
42.7
54.3
10.8
8.5
1.7
1.5
15.6
17.2
0.6
0.5
TVS Motor
Neutral
572
-
27,194
13,390
15,948
6.9
7.1
12.8
16.5
44.9
34.6
11.2
8.8
26.3
27.2
2.1
1.7
Amara Raja Batteries
Buy
833
962
14,234
5,339
6,220
15.9
15.3
28.0
32.3
29.8
25.8
5.7
4.8
19.1
18.5
2.7
2.3
Exide Industries
Neutral
218
-
18,568
7,439
8,307
15.0
15.0
8.1
9.3
27.0
23.5
3.8
3.4
14.3
16.7
2.1
1.9
Apollo Tyres
Neutral
254
-
12,914
12,877
14,504
14.3
13.9
21.4
23.0
11.8
11.0
1.8
1.6
16.4
15.2
1.2
1.1
Ceat
Neutral
1,828
-
7,396
7,524
8,624
13.0
12.7
131.1
144.3
14.0
12.7
2.6
2.2
19.8
18.6
1.1
0.9
JK Tyres
Neutral
163
-
3,690
7,455
8,056
15.0
15.0
21.8
24.5
7.5
6.6
1.6
1.3
22.8
21.3
0.6
0.5
Swaraj Engines
Neutral
2,169
-
2,694
660
810
15.2
16.4
54.5
72.8
39.8
29.8
12.4
11.3
31.5
39.2
3.9
3.2
Subros
Neutral
244
-
1,466
1,488
1,681
11.7
11.9
6.4
7.2
38.2
34.1
4.0
3.7
10.8
11.4
1.2
1.1
Indag Rubber
Neutral
199
-
523
286
326
19.8
16.8
11.7
13.3
17.0
14.9
2.9
2.7
17.8
17.1
1.5
1.3
Capital Goods
ACE
Neutral
73
-
718
709
814
4.1
4.6
1.4
2.1
51.9
34.6
2.1
2.0
4.4
6.0
1.2
1.0
BEML
Neutral
1,536
-
6,398
3,451
4,055
6.3
9.2
31.4
57.9
48.9
26.5
2.9
2.7
6.3
10.9
2.0
1.7
Bharat Electronics
Neutral
173
-
38,541
8,137
9,169
16.8
17.2
58.7
62.5
2.9
2.8
0.5
0.4
44.6
46.3
3.7
3.3
Stock Watch
July 21, 2017
Company Name
Reco
CMP
Target
Mkt Cap
Sales ( Čcr )
OPM(%)
EPS (Č)
PER(x)
P/BV(x)
RoE(%)
EV/Sales(x)
(Č)
Price ( Č)
( Č cr )
FY17E
FY18E
FY17E
FY18E
FY17E
FY18E
FY17E
FY18E
FY17E
FY18E
FY17E
FY18E
FY17E
FY18E
Capital Goods
Voltas
Neutral
491
-
16,256
6,511
7,514
7.9
8.7
12.9
16.3
38.1
30.1
6.9
6.0
16.7
18.5
2.2
1.9
BGR Energy
Neutral
151
-
1,087
16,567
33,848
6.0
5.6
7.8
5.9
19.3
25.5
1.1
1.1
4.7
4.2
0.2
0.1
BHEL
Neutral
147
-
35,857
28,797
34,742
-
2.8
2.3
6.9
63.7
21.2
1.1
1.1
1.3
4.8
0.9
0.6
Blue Star
Buy
655
760
6,269
4,283
5,077
5.9
7.3
14.9
22.1
44.0
29.6
8.5
7.2
20.4
26.4
1.5
1.3
CG Power and Industrial
Neutral
86
-
5,387
5,777
6,120
5.9
7.0
3.3
4.5
26.1
19.1
1.1
1.1
4.4
5.9
0.9
0.8
Solutions
Greaves Cotton
Neutral
163
-
3,987
1,755
1,881
16.8
16.9
7.8
8.5
20.9
19.2
4.2
3.9
20.6
20.9
2.0
1.8
Inox Wind
Neutral
139
-
3,074
5,605
6,267
15.7
16.4
24.8
30.0
5.6
4.6
1.6
1.1
25.9
24.4
0.6
0.5
KEC International
Neutral
295
-
7,575
9,294
10,186
7.9
8.1
9.9
11.9
29.8
24.8
4.4
3.8
15.6
16.3
1.1
1.0
KEI Industries
Accumulate
240
258
1,864
2,633
3,001
10.4
10.0
12.7
13.0
18.8
18.4
4.0
3.4
21.4
18.2
0.9
0.8
Thermax
Neutral
934
-
11,129
5,421
5,940
7.3
7.3
25.7
30.2
36.3
30.9
4.4
4.0
12.2
13.1
1.9
1.8
VATech Wabag
Accumulate
603
681
3,291
3,136
3,845
8.9
9.1
26.0
35.9
23.2
16.8
2.9
2.5
13.4
15.9
1.0
0.8
Cement
ACC
Neutral
1,716
-
32,215
11,225
13,172
13.2
16.9
44.5
75.5
38.6
22.7
3.7
3.4
11.2
14.2
2.9
2.5
Ambuja Cements
Neutral
262
-
52,044
9,350
10,979
18.2
22.5
5.8
9.5
45.2
27.6
3.8
3.4
10.2
12.5
5.6
4.7
India Cements
Neutral
209
-
6,445
4,364
4,997
18.5
19.2
7.9
11.3
26.5
18.5
1.9
1.9
8.0
8.5
2.2
2.0
JK Cement
Neutral
979
-
6,846
4,398
5,173
15.5
17.5
31.2
55.5
31.4
17.7
3.8
3.3
12.0
15.5
2.1
1.8
J K Lakshmi Cement
Neutral
464
-
5,459
2,913
3,412
14.5
19.5
7.5
22.5
61.9
20.6
3.8
3.2
12.5
18.0
2.5
2.1
Orient Cement
Neutral
163
-
3,333
2,114
2,558
18.5
20.5
8.1
11.3
20.1
14.4
3.0
2.5
9.0
14.0
2.2
1.7
UltraTech Cement
Neutral
4,143
-
113,746
25,768
30,385
21.0
23.5
111.0
160.0
37.3
25.9
4.8
4.2
13.5
15.8
4.5
3.8
Construction
ITNL
Neutral
95
-
3,119
8,946
10,017
31.0
31.6
8.1
9.1
11.7
10.4
0.4
0.4
4.2
5.0
3.7
3.4
KNR Constructions
Neutral
213
-
2,994
1,385
1,673
14.7
14.0
41.2
48.5
5.2
4.4
1.0
0.8
14.9
15.2
2.2
1.9
Larsen & Toubro
Buy
1,186
1,700
166,097
111,017
124,908
11.0
11.0
61.1
66.7
19.4
17.8
2.3
2.2
13.1
12.9
2.5
2.3
Gujarat Pipavav Port
Neutral
147
-
7,107
705
788
52.2
51.7
5.0
5.6
29.4
26.3
2.9
2.6
11.2
11.2
9.7
8.2
Nagarjuna Const.
Neutral
91
-
5,081
8,842
9,775
9.1
8.8
5.3
6.4
17.3
14.3
1.4
1.3
8.2
9.1
0.7
0.6
PNC Infratech
Neutral
140
-
3,593
2,350
2,904
13.1
13.2
9.0
8.8
15.6
15.9
0.6
0.5
15.9
13.9
1.6
1.3
Simplex Infra
Neutral
512
-
2,532
6,829
7,954
10.5
10.5
31.4
37.4
16.3
13.7
1.7
1.6
9.9
13.4
0.8
0.7
Power Mech Projects
Neutral
582
-
857
1,801
2,219
12.7
14.6
72.1
113.9
8.1
5.1
1.5
1.3
16.8
11.9
0.5
0.4
Sadbhav Engineering
Accumulate
282
298
4,833
3,598
4,140
10.3
10.6
9.0
11.9
31.3
23.7
3.3
2.9
9.9
11.9
1.6
1.4
NBCC
Neutral
216
-
19,427
7,428
9,549
7.9
8.6
8.2
11.0
26.3
19.6
1.3
1.0
28.2
28.7
2.3
1.8
MEP Infra
Neutral
127
-
2,057
1,877
1,943
30.6
29.8
3.0
4.2
42.2
30.1
20.4
13.8
0.6
0.6
2.5
2.3
Stock Watch
July 21, 2017
Company Name
Reco
CMP
Target
Mkt Cap
Sales ( Čcr )
OPM(%)
EPS (Č)
PER(x)
P/BV(x)
RoE(%)
EV/Sales(x)
(Č)
Price ( Č)
( Č cr )
FY17E
FY18E
FY17E
FY18E
FY17E
FY18E
FY17E
FY18E
FY17E
FY18E
FY17E
FY18E
FY17E
FY18E
Construction
SIPL
Neutral
108
-
3,804
1,036
1,252
65.5
66.2
(8.4)
(5.6)
4.0
4.6
(22.8)
(15.9)
11.9
9.9
Engineers India
Neutral
165
-
11,099
1,725
1,935
16.0
19.1
11.4
13.9
14.5
11.9
2.0
1.9
13.4
15.3
5.4
4.8
Financials
Axis Bank
Accumulate
540
580
129,519
46,932
53,575
3.5
3.4
32.4
44.6
16.7
12.1
2.2
1.9
13.6
16.5
-
-
Bank of Baroda
Neutral
162
-
37,304
19,980
23,178
1.8
1.8
11.5
17.3
14.1
9.4
1.6
1.3
8.3
10.1
-
-
Canara Bank
Neutral
352
-
21,031
15,225
16,836
1.8
1.8
14.5
28.0
24.3
12.6
1.7
1.4
5.8
8.5
-
-
Can Fin Homes
Neutral
3,217
-
8,564
420
526
3.5
3.5
86.5
107.8
37.2
29.8
8.0
6.6
23.6
24.1
-
-
Cholamandalam Inv. &
Accumulate
1,141
1,230
17,840
2,012
2,317
6.3
6.3
42.7
53.6
26.7
21.3
4.2
3.6
16.9
18.3
-
-
Fin. Co.
Dewan Housing Finance Accumulate
478
520
14,975
2,225
2,688
2.9
2.9
29.7
34.6
16.1
13.8
2.6
1.7
16.1
14.8
-
-
Equitas Holdings
Buy
169
235
5,718
939
1,281
11.7
11.5
5.8
8.2
29.1
20.6
2.5
2.2
10.9
11.5
-
-
Federal Bank
Accumulate
119
125
23,102
8,259
8,995
3.0
3.0
4.3
5.6
27.7
21.2
2.3
2.2
8.5
10.1
-
-
HDFC
Neutral
1,651
-
263,003
11,475
13,450
3.4
3.4
45.3
52.5
36.5
31.5
7.0
6.2
20.2
20.5
-
-
HDFC Bank
Neutral
1,708
-
439,658
46,097
55,433
4.5
4.5
58.4
68.0
29.3
25.1
5.1
4.3
18.8
18.6
-
-
ICICI Bank
Neutral
301
-
192,741
42,800
44,686
3.1
3.3
18.0
21.9
16.7
13.7
2.3
2.1
11.1
12.3
-
-
Karur Vysya Bank
Accumulate
141
160
8,503
5,640
6,030
3.3
3.2
8.9
10.0
15.8
14.1
1.7
1.5
11.2
11.4
-
-
Lakshmi Vilas Bank
Neutral
202
-
3,878
3,339
3,799
2.7
2.8
11.0
14.0
18.4
14.4
1.9
1.7
11.2
12.7
-
-
LIC Housing Finance
Neutral
751
-
37,898
3,712
4,293
2.6
2.5
39.0
46.0
19.3
16.3
3.6
3.1
19.9
20.1
-
-
Punjab Natl.Bank
Neutral
157
-
33,345
23,532
23,595
2.3
2.4
6.8
12.6
23.0
12.4
3.6
2.5
3.3
6.5
-
-
RBL Bank
Neutral
539
-
20,317
1,783
2,309
2.6
2.6
12.7
16.4
42.5
32.9
4.6
4.1
12.8
13.3
-
-
Repco Home Finance
Neutral
814
-
5,094
388
457
4.5
4.2
30.0
38.0
27.1
21.4
4.5
3.8
18.0
19.2
-
-
South Ind.Bank
Neutral
28
-
5,095
6,435
7,578
2.5
2.5
2.7
3.1
10.5
9.1
1.4
1.1
10.1
11.2
-
-
St Bk of India
Neutral
291
-
250,891
88,650
98,335
2.6
2.6
13.5
18.8
21.5
15.5
2.1
1.8
7.0
8.5
-
-
Union Bank
Neutral
154
-
10,556
13,450
14,925
2.3
2.3
25.5
34.5
6.0
4.5
0.9
0.8
7.5
10.2
-
-
Yes Bank
Neutral
1,571
-
71,875
8,978
11,281
3.3
3.4
74.0
90.0
21.2
17.5
4.0
3.4
17.0
17.2
-
-
FMCG
Akzo Nobel India
Neutral
1,816
-
8,709
2,955
3,309
13.3
13.7
57.2
69.3
31.8
26.2
10.4
8.7
32.7
33.3
2.7
2.4
Asian Paints
Neutral
1,157
-
110,970
17,128
18,978
16.8
16.4
19.1
20.7
60.6
55.9
21.1
19.9
34.8
35.5
6.4
5.8
Britannia
Neutral
3,789
-
45,486
9,594
11,011
14.6
14.9
80.3
94.0
47.2
40.3
19.4
15.0
41.2
-
4.6
4.0
Colgate
Neutral
1,063
-
28,913
4,605
5,149
23.4
23.4
23.8
26.9
44.7
39.5
24.7
19.3
64.8
66.8
6.2
5.5
Dabur India
Neutral
302
-
53,154
8,315
9,405
19.8
20.7
8.1
9.2
37.3
32.8
10.4
8.6
31.6
31.0
6.0
5.3
GlaxoSmith Con*
Neutral
5,460
-
22,964
4,350
4,823
21.2
21.4
179.2
196.5
30.5
27.8
8.1
6.9
27.1
26.8
4.7
4.1
Stock Watch
July 21, 2017
Company Name
Reco
CMP
Target
Mkt Cap
Sales ( Čcr )
OPM(%)
EPS (Č)
PER(x)
P/BV(x)
RoE(%)
EV/Sales(x)
(Č)
Price ( Č)
( Č cr )
FY17E FY18E
FY17E
FY18E
FY17E
FY18E
FY17E
FY18E
FY17E
FY18E
FY17E
FY18E
FY17E
FY18E
FMCG
Godrej Consumer
Neutral
956
-
65,143
10,235
11,428
18.4
18.6
41.1
44.2
23.3
21.6
5.2
4.4
24.9
24.8
6.4
5.7
HUL
Neutral
1,153
-
249,509
35,252
38,495
17.8
17.8
20.7
22.4
55.8
51.5
53.4
45.8
95.6
88.9
6.9
6.3
ITC
Neutral
290
-
352,389
40,059
44,439
38.3
39.2
9.0
10.1
32.3
28.6
9.0
7.9
27.8
27.5
8.3
7.5
Marico
Neutral
326
-
42,018
6,430
7,349
18.8
19.5
6.4
7.7
50.9
42.3
15.4
12.9
33.2
32.5
6.3
5.5
Nestle*
Neutral
6,859
-
66,132
10,073
11,807
20.7
21.5
124.8
154.2
55.0
44.5
22.6
20.3
34.8
36.7
6.4
5.4
Tata Global
Neutral
171
-
10,811
8,675
9,088
9.8
9.8
7.4
8.2
23.2
20.9
1.8
1.7
7.9
8.1
1.2
1.1
Procter & Gamble
Neutral
8,000
-
25,969
2,939
3,342
23.2
23.0
146.2
163.7
54.7
48.9
13.9
11.5
25.3
23.5
8.4
7.3
Hygiene
IT
HCL Tech^
Accumulate
885
1,014
126,338
46,723
52,342
22.1
20.9
60.0
62.8
14.8
14.1
3.7
3.2
25.3
22.4
2.4
2.1
Infosys
Buy
969
1,179
222,574
68,484
73,963
26.0
26.0
63.0
64.0
15.4
15.1
3.2
3.0
20.8
19.7
2.9
2.6
TCS
Accumulate
2,445
2,651
481,809
117,966
127,403
27.5
27.6
134.3
144.5
18.2
16.9
5.4
5.0
29.8
29.7
3.7
3.5
Tech Mahindra
Buy
392
533
38,209
29,141
31,051
14.4
15.0
32.3
35.6
12.1
11.0
2.1
1.9
17.1
17.0
1.2
1.0
Wipro
Neutral
269
-
130,906
55,421
58,536
20.3
20.3
35.1
36.5
7.7
7.4
1.3
1.1
19.2
14.6
1.8
1.5
Media
D B Corp
Neutral
375
-
6,892
2,297
2,590
27.4
28.2
21.0
23.4
17.8
16.0
4.2
3.6
23.7
23.1
2.8
2.4
HT Media
Neutral
86
-
1,990
2,693
2,991
12.6
12.9
7.9
9.0
10.8
9.5
0.9
0.9
7.8
8.3
0.3
0.2
Jagran Prakashan
Buy
173
225
5,643
2,283
2,555
28.0
28.0
10.6
12.3
16.2
14.1
3.5
3.0
21.4
21.4
2.5
2.2
Sun TV Network
Neutral
828
-
32,622
2,850
3,265
70.1
71.0
26.2
30.4
31.6
27.2
8.1
7.1
24.3
25.6
11.0
9.5
Hindustan Media
Neutral
279
-
2,049
1,016
1,138
24.3
25.2
27.3
30.1
10.2
9.3
1.9
1.7
16.2
15.8
1.3
1.2
Ventures
TV Today Network
Buy
250
344
1,491
608
667
21.5
22.3
15.7
19.2
15.9
13.0
2.4
2.1
16.1
16.0
2.1
1.8
Metals & Mining
Coal India
Neutral
255
-
158,568
84,638
94,297
21.4
22.3
24.5
27.1
10.4
9.4
4.3
4.1
42.6
46.0
1.4
1.2
Hind. Zinc
Neutral
281
-
118,753
14,252
18,465
55.9
48.3
15.8
21.5
17.8
13.1
2.9
2.5
17.0
20.7
8.3
6.4
Hindalco
Neutral
214
-
47,954
107,899
112,095
7.4
8.2
9.2
13.0
23.2
16.4
1.1
1.1
4.8
6.6
1.0
0.9
JSW Steel
Neutral
215
-
51,898
53,201
58,779
16.1
16.2
130.6
153.7
1.6
1.4
0.2
0.2
14.0
14.4
1.7
1.5
NMDC
Neutral
124
-
39,074
6,643
7,284
44.4
47.7
7.1
7.7
17.4
16.0
1.5
1.5
8.8
9.2
3.7
3.3
SAIL
Neutral
63
-
25,978
47,528
53,738
(0.7)
2.1
(1.9)
2.6
24.2
0.7
0.7
(1.6)
3.9
1.4
1.3
Vedanta
Neutral
270
-
100,197
71,744
81,944
19.2
21.7
13.4
20.1
20.1
13.4
1.7
1.6
8.4
11.3
1.8
1.4
Tata Steel
Neutral
556
-
53,990
121,374
121,856
7.2
8.4
18.6
34.3
29.9
16.2
1.9
1.7
6.1
10.1
1.1
1.1
Oil & Gas
GAIL
Neutral
379
-
64,067
56,220
65,198
9.3
10.1
27.1
33.3
14.0
11.4
1.3
1.2
9.3
10.7
1.3
1.1
ONGC
Neutral
166
-
212,903
137,222
152,563
15.0
21.8
19.5
24.1
8.5
6.9
0.7
0.7
8.5
10.1
1.8
1.6
Indian Oil Corp
Neutral
375
-
181,878
373,359
428,656
5.9
5.5
54.0
59.3
6.9
6.3
1.1
1.0
16.0
15.6
0.6
0.6
Stock Watch
July 21, 2017
Company Name
Reco
CMP
Target
Mkt Cap
Sales ( Čcr )
OPM(%)
EPS (Č)
PER(x)
P/BV(x)
RoE(%)
EV/Sales(x)
(Č)
Price ( Č)
( Č cr )
FY17E FY18E
FY17E
FY18E
FY17E
FY18E
FY17E
FY18E
FY17E
FY18E
FY17E
FY18E
FY17E
FY18E
Oil & Gas
Reliance Industries
Neutral
1,529
-
497,093
301,963
358,039
12.1
12.6
87.7
101.7
17.4
15.0
1.8
1.6
10.7
11.3
2.1
1.8
Pharmaceuticals
Alembic Pharma
Buy
558
648
10,521
3,101
3,966
19.7
20.5
21.4
25.5
26.1
21.9
5.5
4.5
23.0
22.8
3.4
2.5
Alkem Laboratories Ltd
Buy
1,808
2,161
21,612
5,853
6,901
17.1
18.4
74.6
85.0
24.2
21.3
5.1
4.3
21.1
20.2
3.7
3.1
Aurobindo Pharma
Accumulate
750
823
43,956
14,845
17,086
21.5
22.1
39.4
44.7
19.0
16.8
4.7
3.7
27.6
24.7
3.1
2.7
Aventis*
Neutral
4,189
-
9,649
2,206
2,508
16.6
16.8
128.9
139.9
32.5
30.0
5.6
4.4
21.6
23.5
4.1
3.5
Cadila Healthcare
Reduce
528
450
54,002
9,220
11,584
18.4
20.3
14.5
18.7
36.4
28.2
7.8
6.3
23.5
24.6
6.2
4.7
Cipla
Sell
572
461
45,995
14,281
16,619
15.4
16.2
12.5
19.7
45.7
29.0
3.7
3.3
8.4
12.0
3.4
2.9
Dr Reddy's
Neutral
2,746
-
45,518
14,081
15,937
16.1
18.6
72.6
105.9
37.8
25.9
3.7
3.3
9.6
13.6
3.5
3.1
Dishman Pharma
Sell
143
1,718
1,890
22.7
22.8
9.5
11.3
10.1
10.9
3.3
2.9
GSK Pharma*
Neutral
2,547
-
21,571
2,927
3,290
11.8
16.2
34.4
49.6
74.0
51.3
10.8
11.2
13.9
21.3
7.2
6.4
Indoco Remedies
Sell
205
153
1,893
1,067
1,154
12.1
14.9
8.4
11.3
24.5
18.2
2.9
2.6
12.6
15.0
2.0
1.9
Ipca labs
Buy
479
620
6,040
3,211
3,593
13.9
14.5
15.4
19.4
31.1
24.7
2.5
2.3
8.2
9.5
2.0
1.7
Lupin
Buy
1,166
1,526
52,671
17,120
18,657
24.1
24.1
56.9
61.1
20.5
19.1
3.9
3.3
20.7
18.6
3.4
2.8
Natco Pharma
Accumulate
1,006
1,060
17,538
2,065
1,988
33.1
33.7
27.9
25.7
36.1
39.1
10.5
9.0
29.2
22.9
8.6
8.7
Sun Pharma
Buy
582
712
139,660
30,264
32,899
29.0
26.9
32.7
31.6
17.8
18.4
3.8
3.3
22.2
18.7
4.3
3.9
Power
Tata Power
Neutral
83
-
22,423
36,916
39,557
17.4
27.1
5.1
6.3
16.3
13.2
1.4
1.3
9.0
10.3
1.6
1.5
NTPC
Neutral
165
-
136,298
86,605
95,545
17.5
20.8
11.8
13.4
14.0
12.3
1.4
1.3
10.5
11.1
2.9
2.9
Power Grid
Neutral
219
-
114,546
25,315
29,193
88.2
88.7
14.2
17.2
15.5
12.8
2.4
2.1
15.2
16.1
9.2
8.2
Real Estate
Prestige Estate
Neutral
251
-
9,413
4,707
5,105
25.2
26.0
10.3
13.0
24.4
19.3
2.0
1.8
10.3
10.2
3.2
2.8
MLIFE
Buy
440
522
2,256
1,152
1,300
22.7
24.6
29.9
35.8
14.7
12.3
1.1
1.0
7.6
8.6
2.7
2.3
Telecom
Bharti Airtel
Neutral
420
-
167,791
105,086
114,808
34.5
34.7
12.2
16.4
34.4
25.6
2.3
2.2
6.8
8.4
2.5
2.2
Idea Cellular
Neutral
95
-
34,204
40,133
43,731
37.2
37.1
6.4
6.5
14.8
14.6
1.2
1.1
8.2
7.6
1.9
1.6
zOthers
Abbott India
Neutral
4,526
-
9,617
3,153
3,583
14.1
14.4
152.2
182.7
29.7
24.8
146.0
124.7
25.6
26.1
2.8
2.4
Asian Granito
Accumulate
432
480
1,299
1,066
1,169
11.6
12.5
13.0
16.0
33.2
27.0
3.2
2.9
9.5
10.7
1.5
1.3
Bajaj Electricals
Buy
335
395
3,401
4,801
5,351
5.7
6.2
10.4
13.7
32.2
24.5
4.0
3.5
12.4
14.5
0.7
0.6
Banco Products (India)
Neutral
235
-
1,677
1,353
1,471
12.3
12.4
14.5
16.3
16.2
14.4
22.3
20.1
14.5
14.6
1.2
127.0
Coffee Day Enterprises
Neutral
246
-
5,067
2,964
3,260
20.5
21.2
4.7
8.0
-
30.7
2.8
2.6
5.5
8.5
2.1
1.9
Ltd
Competent Automobiles Neutral
225
-
144
1,137
1,256
3.1
2.7
28.0
23.6
8.0
9.5
43.2
39.0
14.3
11.5
0.1
0.1
Elecon Engineering
Neutral
60
-
672
1,482
1,660
13.7
14.5
3.9
5.8
15.4
10.3
3.6
3.3
7.8
10.9
0.8
0.7
Stock Watch
July 21, 2017
Company Name
Reco
CMP
Target
Mkt Cap
Sales ( Čcr )
OPM(%)
EPS (Č)
PER(x)
P/BV(x)
RoE(%)
EV/Sales(x)
(Č)
Price ( Č)
( Č cr )
FY17E
FY18E
FY17E
FY18E
FY17E
FY18E
FY17E
FY18E
FY17E
FY18E
FY17E
FY18E
FY17E
FY18E
zOthers
Finolex Cables
Neutral
502
-
7,671
2,883
3,115
12.0
12.1
14.2
18.6
35.3
27.0
18.8
16.4
15.8
14.6
2.4
2.1
Garware Wall Ropes
Neutral
890
-
1,947
863
928
15.1
15.2
36.4
39.4
24.5
22.6
4.4
3.8
17.5
15.9
2.2
2.0
Goodyear India*
Neutral
901
-
2,079
1,598
1,704
10.4
10.2
49.4
52.6
18.2
17.1
84.2
73.9
18.2
17.0
1.0
140.9
Hitachi
Neutral
2,029
-
5,518
2,081
2,433
8.8
8.9
33.4
39.9
60.8
50.9
49.0
40.9
22.1
21.4
2.6
2.2
HSIL
Neutral
389
-
2,811
2,384
2,515
15.8
16.3
15.3
19.4
25.4
20.0
25.3
21.7
7.8
9.3
1.3
1.2
Interglobe Aviation
Neutral
1,244
-
44,978
21,122
26,005
14.5
27.6
110.7
132.1
11.2
9.4
67.2
48.0
168.5
201.1
2.1
1.7
Jyothy Laboratories
Neutral
379
-
6,885
1,440
2,052
11.5
13.0
8.5
10.0
44.6
37.9
10.8
10.0
18.6
19.3
5.1
3.5
Kirloskar Engines India
Neutral
400
-
5,785
2,554
2,800
9.9
10.0
10.5
12.1
38.1
33.1
15.9
15.0
10.7
11.7
1.9
1.7
Ltd
Linc Pen & Plastics
Neutral
278
-
411
382
420
9.3
9.5
13.5
15.7
20.6
17.7
3.5
3.1
17.1
17.3
1.1
1.0
M M Forgings
Neutral
642
-
775
546
608
20.4
20.7
41.3
48.7
15.6
13.2
88.0
77.9
16.6
17.0
1.3
1.1
Manpasand Bever.
Neutral
747
-
4,273
836
1,087
19.6
19.4
16.9
23.8
44.2
31.4
5.3
4.6
12.0
14.8
4.9
3.6
Mirza International
Neutral
169
-
2,028
963
1,069
17.2
18.0
6.1
7.5
27.5
22.5
4.2
3.6
15.0
15.7
2.3
2.1
MT Educare
Neutral
75
-
298
366
417
17.7
18.2
9.4
10.8
8.0
6.9
1.8
1.5
22.2
22.3
0.7
0.6
Narayana Hrudaya
Neutral
302
-
6,172
1,873
2,166
11.5
11.7
2.6
4.0
114.2
76.2
7.0
6.3
6.1
8.3
3.4
2.9
Navkar Corporation
Buy
206
265
2,936
347
371
43.2
37.3
6.7
6.0
30.9
34.3
2.1
1.9
6.2
10.6
9.6
9.0
Navneet Education
Neutral
175
-
4,087
1,062
1,147
24.0
24.0
6.1
6.6
28.7
26.4
5.9
5.2
20.6
19.8
3.9
3.6
Nilkamal
Neutral
1,928
-
2,878
1,995
2,165
10.7
10.4
69.8
80.6
27.6
23.9
110.2
95.7
16.6
16.5
1.4
1.3
Page Industries
Neutral
16,833
-
18,775
2,450
3,124
20.1
17.6
299.0
310.0
56.3
54.3
374.9
286.2
47.1
87.5
7.7
6.1
Parag Milk Foods
Neutral
248
-
2,085
1,919
2,231
9.3
9.6
9.5
12.9
26.3
19.2
4.1
3.4
15.5
17.5
1.2
1.1
Quick Heal
Neutral
225
-
1,578
408
495
27.3
27.0
7.7
8.8
29.0
25.6
2.7
2.7
9.3
10.6
3.0
2.5
Radico Khaitan
Accumulate
130
147
1,735
1,667
1,824
13.0
13.2
6.7
8.2
19.6
15.9
1.8
1.6
9.0
10.2
1.4
1.3
Relaxo Footwears
Neutral
490
-
5,883
2,085
2,469
9.2
8.2
7.6
8.0
64.8
61.6
25.1
21.4
17.9
18.8
2.9
2.5
S H Kelkar & Co.
Neutral
272
-
3,933
1,036
1,160
15.1
15.0
6.1
7.2
44.5
37.9
4.8
4.4
10.7
11.5
3.7
3.2
Siyaram Silk Mills
Neutral
2,403
-
2,253
1,574
1,769
12.5
12.7
97.1
113.1
24.7
21.2
3.8
3.3
15.4
15.5
1.6
1.5
Styrolution ABS India*
Neutral
1,059
-
1,862
1,440
1,537
9.2
9.0
40.6
42.6
26.1
24.9
66.6
60.5
12.3
11.6
1.3
1.1
Surya Roshni
Neutral
293
-
1,282
3,342
3,625
7.8
7.5
17.3
19.8
16.9
14.8
32.1
25.8
10.5
10.8
0.6
0.6
Team Lease Serv.
Neutral
1,447
-
2,474
3,229
4,001
1.5
1.8
22.8
32.8
63.6
44.1
6.8
5.9
10.7
13.4
0.7
0.5
The Byke Hospitality
Neutral
188
-
755
287
384
20.5
20.5
7.6
10.7
24.8
17.6
5.2
4.2
20.7
23.5
2.7
2.0
Transport Corporation of
Neutral
325
-
2,486
2,671
2,911
8.5
8.8
13.9
15.7
23.4
20.7
3.2
2.9
13.7
13.8
1.0
1.0
India
Stock Watch
July 21, 2017
Company Name
Reco
CMP
Target Mkt Cap
Sales ( Čcr )
OPM(%)
EPS (Č)
PER(x)
P/BV(x)
RoE(%)
EV/Sales(x)
(Č)
Price ( Č)
( Č cr )
FY17E FY18E FY17E FY18E FY17E FY18E FY17E FY18E FY17E FY18E FY17E FY18E FY17E FY18E
zOthers
TVS Srichakra
Neutral
3,763
-
2,882
2,304
2,614
13.7
13.8
231.1
266.6
16.3
14.1
422.9
333.0
33.9
29.3
1.3
1.1
UFO Moviez
Neutral
389
-
1,074
619
685
33.2
33.4
30.0
34.9
13.0
11.2
1.8
1.6
13.8
13.9
1.4
1.1
Visaka Industries
Neutral
494
-
784
1,051
1,138
10.3
10.4
21.0
23.1
23.5
21.3
63.3
59.3
9.0
9.2
1.0
0.9
VRL Logistics
Neutral
324
-
2,956
1,902
2,119
16.7
16.6
14.6
16.8
22.2
19.3
4.9
4.3
21.9
22.2
1.7
1.5
VIP Industries
Buy
178
218
2,520
1,270
1,450
10.4
10.4
5.6
6.5
31.8
27.4
6.6
5.8
20.7
21.1
2.0
1.7
Navin Fluorine
Accumulate
674
730
3,320
789
945
21.1
22.4
24.0
28.7
28.1
23.5
4.5
3.9
17.8
18.5
4.1
3.4
Source: Company, Angel Research; Note: *December year end; #September year end; &October year end; Price as on July 20, 2017
Market Outlook
July 21, 2017
DISCLAIMER
Angel Broking Private Limited (hereinafter referred to as “Angel”) is a registered Member of National Stock Exchange of India
Limited,Bombay Stock Exchange Limited and Metropolitan Stock Exchange Limited. It is also registered as a Depository Participant with
CDSL and Portfolio Manager with SEBI. It also has registration with AMFI as a Mutual Fund Distributor. Angel Broking Private Limited is a
registered entity with SEBI for Research Analyst in terms of SEBI (Research Analyst) Regulations, 2014 vide registration number
INH000000164. Angel or its associates has not been debarred/ suspended by SEBI or any other regulatory authority for accessing
/dealing in securities Market. Angel or its associates/analyst has not received any compensation / managed or
co-managed public offering of securities of the company covered by Analyst during the past twelve months.
This document is solely for the personal information of the recipient, and must not be singularly used as the basis of any investment
decision. Nothing in this document should be construed as investment or financial advice. Each recipient of this document should make
such investigations as they deem necessary to arrive at an independent evaluation of an investment in the securities of the companies
referred to in this document (including the merits and risks involved), and should consult their own advisors to determine the merits and
risks of such an investment.
Reports based on technical and derivative analysis center on studying charts of a stock's price movement, outstanding positions and
trading volume, as opposed to focusing on a company's fundamentals and, as such, may not match with a report on a company's
fundamentals. Investors are advised to refer the Fundamental and Technical Research Reports available on our website to evaluate the
contrary view, if any.
The information in this document has been printed on the basis of publicly available information, internal data and other reliable
sources believed to be true, but we do not represent that it is accurate or complete and it should not be relied on as such, as this
document is for general guidance only. Angel Broking Pvt. Limited or any of its affiliates/ group companies shall not be in any way
responsible for any loss or damage that may arise to any person from any inadvertent error in the information contained in this report.
Angel Broking Pvt. Limited has not independently verified all the information contained within this document. Accordingly, we cannot
testify, nor make any representation or warranty, express or implied, to the accuracy, contents or data contained within this document.
While Angel Broking Pvt. Limited endeavors to update on a reasonable basis the information discussed in this material, there may be
regulatory, compliance, or other reasons that prevent us from doing so.
This document is being supplied to you solely for your information, and its contents, information or data may not be reproduced,
redistributed or passed on, directly or indirectly.
Neither Angel Broking Pvt. Limited, nor its directors, employees or affiliates shall be liable for any loss or damage that may arise from
or in connection with the use of this information.